November 23, 2020 🦃
Dashboard
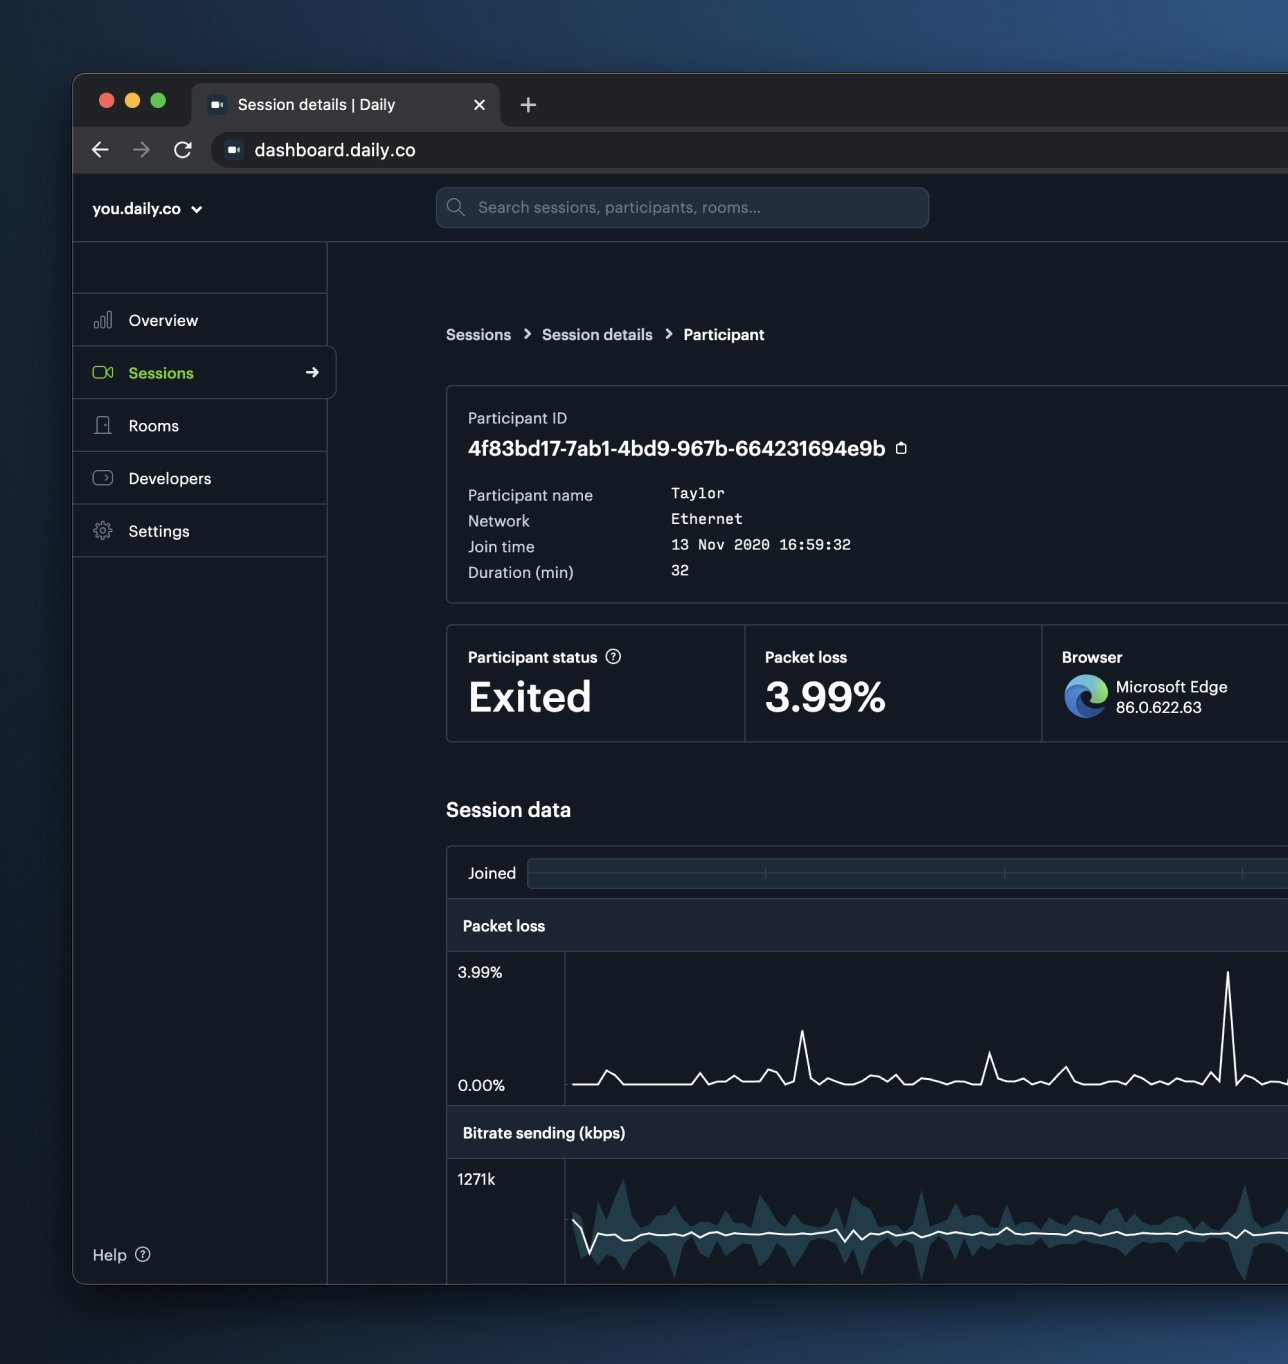
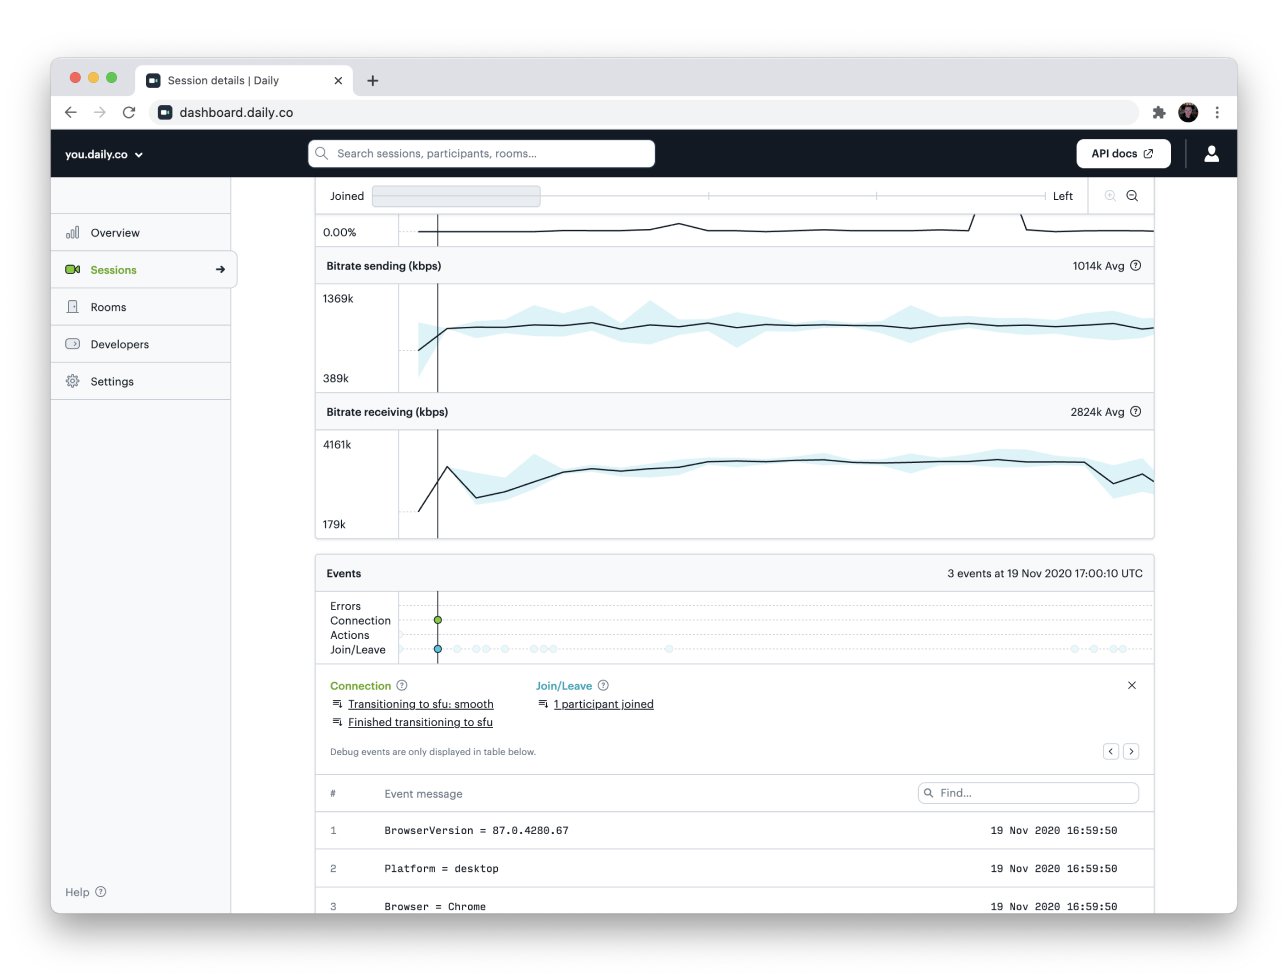
As you may have noticed, the dashboard is now available in Dark Mode. If you visit Settings you can set this explicitly, or it’ll default to match your global system settings. In the Sessions view for each participant will also see a timeline that visualizes four groups of events:- Errors
- Connection mode changes (P2P, SFU switches)
- User actions (mic, cam, screenshare on/off)
- Users joining, leaving, reconnecting
- Free: 1 day
- Launch: 3 days
- Scale: 21 days
- Custom options for enterprise plans
- 📈 Improved the metrics plotting for longer meetings, making it easier to see and interact with call metrics data
- ⚛️ Now display logs and metrics for React Native clients
Core Call Experience
- 🖥 Removed the 2 screenshare limit in call object mode
API
- 🎁 Added new
/presenceendpoint
Libraries
react-native-daily-js 0.3.0 now supports logs and metrics. You can view them in your Dashboard. daily-js now includes several improvements to support features in react-native-daily-js.
daily-js0.9.995- Release Notesdaily-js0.9.994- Release Notesreact-native-daily-js0.3.0- Release Notesreact-native-daily-js0.2.0- Release Notes